
 +62 895 001 924 667



There is no reliable island-wide net rental-yield benchmark for Bali villas. Actual cash yield depends on acquisition cost, booked nights, pricing, operating expenses, taxation and lease duration — and the combination of those variables produces a wide range of outcomes across different properties, locations and ownership structures. Some villa marketing materials promote double-digit gross rental yields. These are projections unless backed by verified operating records, and they exclude costs borne by the owner.
According to AirDNA’s Bali short-term rental data (updated 27 October 2026, covering activity through September 2026), there were approximately 47,993 active short-term rental listings across Bali, with an average daily rate (ADR) of $130 and average annual revenue of $24,800 per active listing. Those averages span budget guestrooms through luxury villas, so they cannot be treated as a direct forecast for a single investment property — but they anchor expectations about the competitive environment any new listing enters. This guide builds a reproducible financial model from total invested capital to cash yield, models three income scenarios side by side, compares the main rental locations on their actual market characteristics, and sets out the due diligence an investor needs before committing capital.
Bali villa rental yield in 2026: quick answer
Bali villa rental yields depend on the acquisition price, nightly rate, occupancy, operating costs, taxes and remaining lease term. There is no reliable island-wide net yield that applies to every villa. In our illustrative $250,000 investment model, annual pre-tax cash yield after a capital expenditure reserve ranges from 3.29% in a conservative scenario to 11.45% in an optimistic scenario.
| Key metric | 2026 figure |
|---|---|
| Active Bali short-term rental listings | 47,993 |
| Average daily rate across active listings | $130 |
| Average annual revenue per active listing | $24,800 |
| Average occupancy of available nights | 57% |
| Average RevPAR | $74 |
| Illustrative investment | $250,000 |
| Conservative pre-tax cash yield | 3.29% |
| Base-case pre-tax cash yield | 7.44% |
| Optimistic pre-tax cash yield | 11.45% |
| Base-case simple payback | Approximately 13.4 years |
Market statistics: AirDNA, updated 27 October 2026, reflecting data through September 2026. Investment figures: ULU Homes illustrative financial model, before income taxes, financing and additional unmodelled obligations. These figures are not guaranteed returns.
What Rental Yield Can Bali Villas Deliver?
Rental yield is not a fixed characteristic of a district or a property category. It is the product of four moving parts: the price paid to acquire the property, the nightly rate guests pay, the proportion of nights that result in bookings, and the costs consumed before any money reaches the owner. Change any one of those variables and the yield changes with it.
This means that two villas in the same street can produce materially different returns — one because the management team prices dynamically and maintains strong platform ratings, the other because the owner took the first management offer and applied a static nightly rate. It also means that a district cannot reliably be assigned a single yield percentage. What gets quoted as “Canggu yield” or “Uluwatu yield” blends properties with very different acquisition costs, age, positioning, and operational standards.
The main factors that determine where any specific villa sits within the market range:
- Total invested capital — the denominator in every yield calculation; paying above market compresses yield before a single booking arrives, and the denominator must include all transaction fees, fit-out, and licence costs, not just the headline purchase price
- Nightly rate and positioning — location, design quality, amenities, and guest review history directly determine achievable ADR
- Calendar occupancy — how many nights per year are actually booked, accounting for maintenance closures, owner use, and seasonal demand gaps
- Management quality — professional managers may improve pricing, distribution and operations, but results depend on fees, property characteristics, execution and market conditions; no systematic advantage can be assumed without comparing the specific management arrangement, its costs, and independently verified results
- Operating cost structure — the ratio of fixed costs (staff, utilities, insurance) to variable costs (platform commissions, cleaning fees per stay) has a direct effect on net income at different occupancy levels
A professionally managed villa in a strong corridor can outperform the market average for its area. A well-located villa managed poorly can underperform despite physical advantages. Neither result should be used to generalise about the whole market.
A villa’s advertised yield is a starting assumption, not evidence of the income an investor will receive.
Gross vs Net Rental Yield
These two metrics are frequently used interchangeably in property marketing even though they measure entirely different things. The table below clarifies the main yield figures an investor will encounter, what each one includes, and why the distinctions matter.
Gross vs Net Yield — Key Metrics Compared
| Metric | What It Includes | What It Excludes | Why Investors Use It |
|---|---|---|---|
| Gross Booking Revenue | Actual accommodation revenue earned from completed bookings; the treatment of cleaning fees, platform-collected taxes and refunds should be defined consistently and applied the same way in every calculation | Any operating or ownership deduction | Headline comparison of earning potential |
| Gross Rental Yield | Gross booking revenue ÷ total invested capital × 100 | All operating costs, taxes, financing | Quick cross-property comparison; widely quoted in marketing |
| Net Operating Income (NOI) | Gross revenue minus ordinary operating expenses | Income tax, financing costs, capital expenditure | Property-level operating profitability before debt and tax; capex reserve is not an NOI deduction |
| Pre-Tax Cash Yield After Capex Reserve | (NOI less planned capex reserve) ÷ total invested capital × 100 | Income tax, financing costs | Operating cash available to the owner after running costs and a set-aside for future capex |
| Net Cash Flow After Tax | Pre-tax cash surplus minus applicable income tax, financing obligations, additional lease payments and any other cash commitments required to maintain the investment | Capital appreciation, lease term depreciation | Actual cash available to the owner after all applicable cash obligations |
| Total Investment Return | Net cash flows plus change in asset value over the holding period | Depends heavily on resale assumptions; not guaranteed | Long-term comparison across different investment types |
The core formulas:
Gross rental yield = Annual gross booking revenue ÷ Total invested capital × 100
Pre-tax cash yield after capex reserve = (Gross revenue − operating expenses − capex reserve) ÷ Total invested capital × 100
One consistent discipline: the denominator in every yield calculation should be total invested capital — the lease acquisition or purchase consideration, transaction taxes and fees, due diligence costs, initial fit-out, licence costs, and any additional capital required to make the villa operational. Using only the headline purchase price inflates every yield figure. When comparing two investment proposals, confirm that both use the same denominator; a developer using purchase price and an independent analyst using total capital invested are not producing comparable numbers.
Financing costs and income tax are typically excluded from gross and net rental yield as defined above, but they reduce the cash an owner ultimately retains. An investor using debt financing to acquire the property should model interest payments separately and calculate their net cash flow after financing and tax as the true bottom line.
A high gross yield does not automatically mean a profitable investment.
How to Calculate Villa Rental Yield
A reproducible model is more useful than a quoted percentage. This section constructs one from total invested capital to cash yield using a single illustrative property, then runs three scenarios through the same arithmetic to show the range of outcomes possible on identical inputs.
A Worked Villa Investment Example
All figures below are illustrative assumptions unless otherwise specified as independently sourced market data. They are not projections for any specific property and do not represent a guarantee of any particular outcome.
- Total invested capital: $250,000 (lease acquisition or purchase consideration plus estimated legal, notary, due diligence, initial fit-out, and licence costs)
- Average nightly rate (ADR): $180
- Annual calendar occupancy: 60% of all 365 nights
- Platform/OTA fees: 12% of gross booking revenue (illustrative blended multi-channel rate — see note below)
- Property management fees: 18% of gross booking revenue (illustrative assumption)
- Other annual running costs: $6,500 (utilities, pool and garden, cleaning supplies, internet, insurance, basic administration)
- Annual maintenance and capex cash reserve: $2,500
Note on fee rates: Airbnb describes its host fee model on its official resource pages, indicating a consolidated host-only fee of 15.5% for applicable listings in 2026. The 12% platform fee used in this example is an illustrative blended rate across multiple booking channels, not the prevailing Airbnb host-only fee. The actual rate for any specific listing and operator must be confirmed directly from the platform and management agreements. The 12% OTA fee and 18% management fee in this model are both calculated independently on gross booking revenue; actual contract bases and applicable channel fees must be substituted before relying on this result. If the management fee is charged on net receipts after OTA deductions, the calculation is different. Conflating the two is one of the most common modelling errors in villa investment analysis.
Sample Bali Villa Rental Yield Calculation (Illustrative)
| Item | Calculation | Annual Amount |
|---|---|---|
| Booked nights | 365 × 60% | 219 nights |
| Gross booking revenue | 219 × $180 | $39,420 |
| Platform/OTA fees (12%) | $39,420 × 12% | −$4,730 |
| Property management fees (18%) | $39,420 × 18% | −$7,096 |
| Other annual running costs | Fixed | −$6,500 |
| Maintenance and capex cash reserve | Fixed | −$2,500 |
| Illustrative annual operating cash surplus | Before income taxes and debt service | $18,594 |
| Pre-tax cash yield after capex reserve | $18,594 ÷ $250,000 × 100 | 7.44% |
Where does every $100 of rental revenue go?
Using the illustrative base-case model, the annual $39,420 booking revenue is allocated as follows:
| Allocation | Annual amount | Per $100 of revenue |
|---|---|---|
| Platform and OTA commissions | $4,730 | $12.00 |
| Property management | $7,096 | $18.00 |
| Other operating costs | $6,500 | $16.49 |
| Maintenance and capex reserve | $2,500 | $6.34 |
| Pre-tax operating cash surplus | $18,594 | $47.17 |
Amounts are rounded. Income taxes, financing, additional lease payments and unmodelled costs are excluded.
For every $100 of accommodation revenue, approximately $47 remains as pre-tax operating cash surplus after the expenses and reserve assumed in this example. This is not the amount an investor necessarily takes home after tax.
The $18,594 is an illustrative annual operating cash surplus after a $2,500 capex reserve, but before income taxes, debt service, additional lease payments and any unmodelled costs. The capex reserve reduces reported cash in the model but accumulates to fund future expenditure such as appliance replacement, repainting, or pool equipment. If the reserve is excluded, the pre-tax figure rises to $21,094 (8.44% of total invested capital), but future capex will arise regardless and must be funded somehow.
Three Occupancy Scenarios
The same villa, modelled across conservative, base, and optimistic assumptions, illustrates how sensitive outcomes are to just two variables: the average rate guests pay and how often the property is booked. All other inputs — total invested capital, fee percentages, fixed running costs, and the capex reserve — remain identical across all three scenarios.
Three Rental Income Scenarios (Illustrative — Same Villa, Same Cost Structure)
| Scenario | ADR | Calendar Occupancy | Booked Nights | Gross Revenue | Cash Surplus Before Tax | Pre-Tax Cash Yield |
|---|---|---|---|---|---|---|
| Conservative | $150 | 45% | 164 | $24,600 | $8,220 | 3.29% |
| Base | $180 | 60% | 219 | $39,420 | $18,594 | 7.44% |
| Optimistic | $210 | 70% | 256 | $53,760 | $28,632 | 11.45% |
Conservative: platform $2,952 + management $4,428 + fixed $9,000 = $16,380. Cash surplus: $24,600 − $16,380 = $8,220. Optimistic: platform $6,451 + management $9,677 + fixed $9,000 = $25,128. Cash surplus: $53,760 − $25,128 = $28,632.
What occupancy is needed to cover annual operating costs?
Using the same illustrative villa model, annual fixed operating costs and the capex reserve total $9,000. The combined platform and management fees consume 30% of booking revenue.
At an ADR of $180, each booked night contributes $126 towards covering those annual costs before tax and financing.
| Metric | Illustrative result |
|---|---|
| Annual fixed costs and capex reserve | $9,000 |
| ADR | $180 |
| Combined revenue-based fees | 30% |
| Contribution per booked night | $126 |
| Booked nights needed to cover modelled costs | 72 nights |
| Calendar occupancy required | Approximately 19.6% |
This is an operating cash break-even threshold under the model’s assumptions, not an investment break-even point. It does not recover the initial $250,000 investment and excludes income taxes, financing, additional lease obligations and unexpected costs.
The spread between conservative and optimistic is more than 8 percentage points of pre-tax cash yield on the same asset. An investment that appears viable at 7.44% becomes difficult to justify at 3.29% — and there is no guarantee that a newly acquired villa will perform at the base case rather than the conservative one, particularly in the first year of operation when reviews and booking history are limited. These are stress-test scenarios, not a guaranteed range; actual results can fall outside any of these three cases.
A brief clarification on how occupancy is measured: AirDNA reports occupancy as a proportion of nights the listing is available for booking, not as a proportion of all 365 calendar nights. Many listings are blocked for part of the year — for owner use, maintenance, or seasonal closure — so the available-nights figure is typically higher than the calendar-nights figure. An AirDNA figure of 57% available-nights occupancy does not translate directly to 57% calendar occupancy. Booked calendar nights = available nights × available-night occupancy rate. The scenarios in Table 3 use calendar occupancy (booked nights ÷ 365), which is the appropriate basis for modelling annual income on a property the investor owns year-round.
Want to Test These Numbers Against a Real Bali Villa?
Tell us your budget, preferred area and rental strategy. ULU Homes can help you shortlist properties and request the information needed to assess their rental potential.
Bali Rental Yields by Location
Bali is not one rental market. The main villa corridors differ in guest profile, supply density, price ceiling, seasonal variation, and the type of traveller willing to pay a premium. A villa in Canggu and a villa in Ubud may have similar acquisition costs but face entirely different booking dynamics.
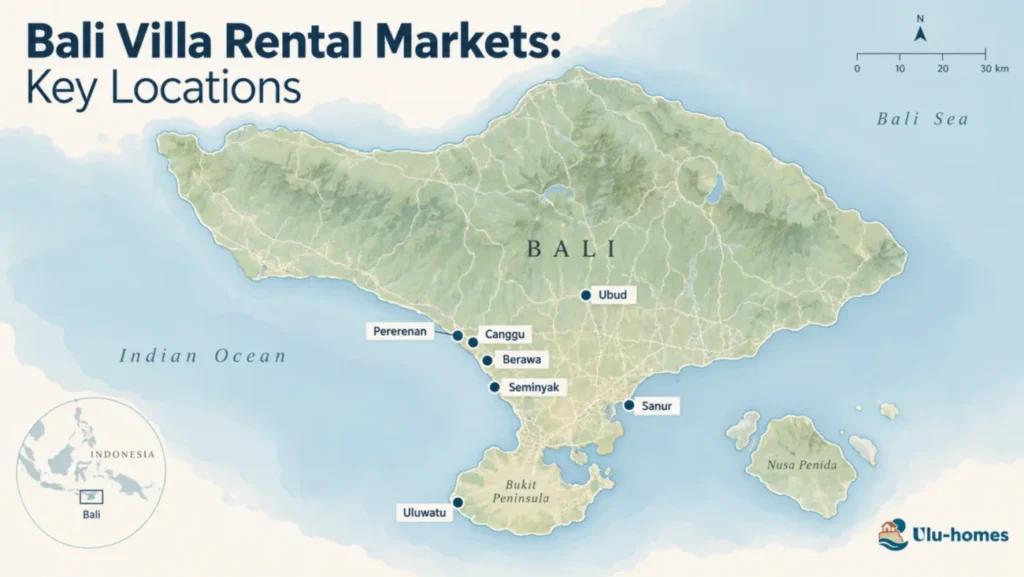
Bali Villa Rental Markets Compared
| Location | Main Guest Demand | Rental Strengths | Main Risks | Best Fit |
|---|---|---|---|---|
| Canggu and Berawa | Digital nomads, surfers, mid-30s couples, short-stay leisure | Active booking market, diverse guest profile, well-established platform presence | High supply density, road congestion, rising acquisition costs | Buyers prioritising occupancy breadth over maximum ADR |
| Pererenan | Lifestyle travellers seeking quieter alternative to Canggu | Growing café and restaurant scene, emerging appeal | Infrastructure still developing, distance from main venues adds friction for some guests | Investors comfortable with earlier-stage location risk |
| Uluwatu and Pecatu | Surf travellers, honeymoon market, boutique luxury seekers | High ADR potential at suitable properties, clifftop scenery, limited supply on cliff edge | Seasonal demand variation, limited road access, 45-minute drive from airport | Buyers targeting premium positioning with tolerance for occupancy volatility |
| Seminyak | Established leisure travellers, mid-to-high-end couples, returning visitors | Mature market, proximity to airport and restaurants, proven demand profile | Premium land prices, older stock competing with new supply, limited new-build sites | Investors buying existing proven performers rather than development projects |
| Ubud | Wellness retreat guests, culture-focused travellers, guests seeking multi-night itineraries | Differentiated positioning, distinct guest profile not competing directly with beach corridors | Distance from beach limits addressable market, rainy season can suppress bookings, narrower guest base | Buyers seeking niche lifestyle positioning with lower operational intensity |
| Sanur | Families, retirees, repeat Asia-Pacific visitors, slower-pace seekers | Relaxed infrastructure, lower congestion, proximity to Nusa Penida fast-boat terminals | Lower ADR ceiling for most property types, limited appeal to younger or nightlife-oriented segment | Conservative investors or those targeting the long-term residential rental market |
Bali short-term rental performance by area: 2026 data
The following figures illustrate how short-term rental performance differs between Bali’s main investment areas. They cover different accommodation types and should not be interpreted as the expected performance of a specific villa.
| Area | Average nightly rate | Occupancy | Annual revenue per listing |
|---|---|---|---|
| Seminyak | Rp 4.92 million | 38.0% | Rp 514 million |
| Uluwatu | Rp 4.32 million | 46.2% | Rp 491 million |
| Pererenan | Rp 3.68 million | 40.2% | Rp 386 million |
| Canggu | Rp 3.79 million | 36.2% | Rp 376 million |
| Ubud | Rp 2.00 million | 36.6% | Rp 206 million |
Source: AirROI area-level figures reported by Rise Real Bali, September 2026. Revenue covers the trailing 12 months; year-on-year comparisons use August 2025–July 2026. Figures are reported in Indonesian rupiah and reflect the source’s currency conversion. They are third-party estimates, not audited villa operating statements.
These figures should not be compared directly with AirDNA’s Bali-wide occupancy without checking methodology, listing selection and available-night definitions. A specific investment should be assessed using comparable villas with similar bedroom counts, amenities, location and rental availability.
Several important clarifications apply across this table. None of these locations is a uniform market within its own boundaries. Local purchase prices, competition and achievable ADR vary widely within each district and should be checked against recent comparable villas at the property level. Road access, proximity to attractions, surrounding construction, and the immediate neighbourhood can all influence both bookings and pricing in ways that a district-level summary cannot capture.
Supply risk deserves particular attention in Canggu, where villa and apartment development has been substantial. When new supply grows faster than tourist arrivals, both ADR and occupancy can compress simultaneously. BPS Statistics Indonesia reported 685,994 international tourist arrivals in Bali in August 2026 alone, with Australians representing 23.51% of that total — figures that reflect broad underlying demand. The same BPS report records hotel occupancy at 68.19% for classified star properties and 43.16% for non-star accommodation in August 2026. Neither hotel figure predicts what a specific private villa will achieve; hotels and short-term rental villas serve different guest segments through different selection and booking processes, and the statistical samples are not comparable.
What changed in Bali’s rental market in 2026?
AirDNA’s September 2026 market snapshot shows that the average daily rate across Bali short-term rentals declined by 14.6% year on year, while reported occupancy increased by 27.3% and RevPAR rose by 9.7%. Active listings fell by 45.6% under AirDNA’s reporting methodology.
These changes illustrate why investors should not rely on a single headline metric. Higher occupancy does not necessarily mean higher nightly rates, and a change in active listing counts does not by itself prove that physical villa supply has declined.
For investment underwriting, compare at least 12 months of performance for similar properties, review pricing and occupancy separately, and investigate changes in competing supply.
Source: AirDNA Bali market overview, updated 27 October 2026.
Does villa size affect rental yield?
Bedroom count changes both the revenue potential and the acquisition cost of a rental villa. Larger villas may command higher nightly rates, but they also require more capital and can have higher staffing, cleaning, maintenance and refurbishment costs.
A one-bedroom villa can generate a higher percentage yield than a larger property if its acquisition price is sufficiently low relative to its rental revenue. Conversely, a larger villa may generate more total cash income while producing a lower percentage return on invested capital.
| Villa size | Main investment consideration |
|---|---|
| 1-bedroom | Lower absolute capital requirement may improve percentage returns |
| 2-bedroom | Balance between acquisition cost, guest capacity and operating expenses |
| 3-bedroom | Higher potential booking value, but greater capital and maintenance requirements |
| 4+ bedrooms | Larger group bookings, more complex operations and potentially more variable demand |
There is no universal highest-yielding bedroom category. Compare properties using the same rental assumptions, full acquisition costs, actual comparable booking data and remaining lease duration.
Explore Bali Villas In Canggu





What Affects Villa Occupancy?
Occupancy is the variable most investors underestimate before purchase and most management companies present optimistically in their projections. Two villas with identical nightly rates can have radically different annual revenue if one sustains 65% calendar occupancy and the other achieves 45%.

Seasonality is among the most predictable demand factors. Bali’s peak demand periods — July, August, and the December–January window — can push a well-positioned villa toward high occupancy. The shoulder months from April to June and September to October typically deliver moderate demand. Rainy-season months from November through early March, the Christmas-New Year period aside, can see occupancy fall sharply for villas dependent on sun-seeking leisure travellers. Demand patterns vary by property segment; wellness retreats and surf-oriented villas, for example, may follow different seasonal curves. Annual modelling is more realistic than applying a single flat occupancy rate across all twelve months.
Location and accessibility influence booking conversion directly. Villas within a short drive of the beach or a recognised venue cluster attract more spontaneous short-break bookings. More remote properties need a specific audience — retreat groups, families seeking privacy, wellness guests — that is narrower and may require longer lead times to fill.
Reviews and ratings accumulate over time on booking platforms and influence both conversion rate and the price a listing can sustain. A new listing may need time to build reviews and booking history, but first-year performance cannot be inferred from review count alone; the property’s physical characteristics, pricing, and management quality matter alongside the review record.
Dynamic pricing and distribution are often the decisive operational factors. A fixed nightly rate applied regardless of season, local competition, or booking lead time leaves revenue on the table during periods of strong demand and loses bookings during weaker periods.
Revenue per calendar night is a useful way to see why maximising nightly rate is not always the right objective: at $250 ADR and 50% calendar occupancy, gross annual revenue is approximately $45,625; at $200 ADR and 65% calendar occupancy, approximately $47,450, before costs. The lower rate at higher occupancy produces the greater annual income. The standard industry metric RevPAR (revenue per available night) is calculated by dividing accommodation revenue by the number of nights the property is available for booking — not the full 365 calendar nights. If a villa is unavailable for part of the year, its standard RevPAR will differ from revenue per calendar night. Either metric highlights the same trade-off: occupancy and rate together determine income, not rate alone.
Holding ADR at $180 and applying the model’s combined 30% revenue-based fees, a 10-percentage-point change in calendar occupancy changes annual pre-tax cash surplus by approximately $4,599. The effect is meaningful but more modest than a simultaneous change in both rate and occupancy — as the three scenarios in Table 3 demonstrate.
Operating Costs That Reduce Net Yield

Every cost category below reduces the gap between gross booking revenue and the cash that reaches an owner. Before signing a management agreement or completing a purchase, request itemised figures for each from the operator or vendor.
Variable costs (scale with revenue or number of stays):
- Platform and OTA commissions — charged as a percentage of each booking; confirm the rate and the base it is applied to in the specific account agreement. Airbnb’s consolidated host-only fee structure is described on its hosting resource pages; rates and structures for other channels should be verified separately
- Property management fees — typically a percentage of gross booking revenue; clarify whether this is charged before or after OTA commissions are deducted, and what services it covers
- Cleaning and laundry — charged per stay; frequency scales directly with the number of check-ins and the size of the villa
- Guest consumables — toiletries, welcome provisions, coffee, kitchen supplies
Fixed and semi-fixed costs (relatively stable regardless of booking volume):
- Electricity and water — pool pumps, air-conditioning, and water heating can make these costs material for a villa with a pool and extensive cooling; obtain 12 months of actual utility bills before purchase, as real statements provide a more reliable basis for projections than generic estimates
- Pool and garden maintenance — routine chemical treatment, landscaping, equipment checks
- Staffing — housekeeper, gardener, caretaker, or security, depending on villa size and local property expectations; employment obligations under Indonesian law should be clarified upfront
- Internet and streaming services
- Insurance — property and liability coverage, where available and applicable
- Accounting, bookkeeping, and tax administration
- Local levies and applicable accommodation-related charges
Periodic and capital costs:
- Furniture, fixtures, and appliance replacement — these assets depreciate; a cash reserve set aside annually is more manageable than absorbing a large refurbishment as a surprise expense
- Structural repairs and major maintenance
- Pre-season refurbishment — repainting, deep cleaning, garden reset
Operating cost checklist to request from the management company or vendor:
- Itemised operating cost statements for the past 12–24 months
- Utility bills (electricity, water) for the same period, with meter readings if available
- Written clarification of the management fee base — gross booking revenue, net receipts after OTA commissions, or another agreed formula
- Full breakdown of what is included in the management fee versus what is charged additionally (e.g., maintenance call-outs, deep cleaning, major repairs)
- Staffing arrangements, employment costs, and any mandatory severance obligations under Indonesian labour law
- Schedule of planned maintenance and any expenditure that has been deferred
- History of extraordinary or capital expenditures in the past three years
A rough working assumption that combined operating costs consume 40–55% of gross booking revenue is sometimes used to estimate net yield quickly. This range is an illustrative modelling shorthand, not an independently audited market average — actual costs vary significantly by villa size, staffing structure, physical condition, and management arrangement. Any specific acquisition should be modelled from actual or estimated line-item figures, not from a percentage rule.
Short-Term vs Long-Term Rental
The choice between nightly rental (short-term rental, STR) and leasing to a single tenant for six months or more (long-term rental, LTR) involves a genuine trade-off between revenue ceiling and operational burden.
Short-term rental offers the higher potential revenue per night, particularly during peak season. A well-managed two-bedroom villa in an active corridor can achieve ADR that would produce substantially more annual income than the same villa on a fixed monthly lease — when occupancy is sufficient. The trade-offs are real: every booking requires cleaning, guest communication, platform management, and operational oversight. Variable costs as a proportion of revenue are higher. Regulatory requirements for STR — commercial accommodation licences, zoning compliance, tax registration — are more demanding than for a straightforward residential tenancy. And seasonality introduces revenue volatility that a fixed lease eliminates.
Long-term rental provides contractually fixed income paid monthly or quarterly. Management overhead is lower: no per-stay cleaning, no platform commissions, fewer guest service demands. Cash flow predictability is easier to plan around. The limitations are a lower income ceiling and less personal flexibility with the property, along with the risk of a vacancy period between tenants.
Short-term vs long-term rental: illustrative income comparison
The following example compares two rental strategies for the same property using assumed, not market-verified, figures.
| Metric | Short-term rental | Long-term rental |
|---|---|---|
| Annual gross rental revenue | $39,420 | $30,000 |
| OTA commissions | $4,730 | $0 |
| Property management | $7,096 | $1,500 |
| Other operating costs | $6,500 | $2,500 |
| Capex reserve | $2,500 | $2,500 |
| Annual cash surplus before tax | $18,594 | $23,500 |
| Pre-tax cash yield on $250,000 | 7.44% | 9.40% |
Illustrative assumptions only. The LTR column assumes $2,500 monthly rent collected for 12 months, 5% management fees and the listed owner expenses. No claim is made that these rents or costs are achievable for a specific Bali villa. Tenant vacancy, leasing costs, income taxes, financing and additional lease payments are not modelled.
In this particular example, long-term rental produces higher annual pre-tax cash surplus despite lower gross revenue. This illustrates why the strategy with the highest headline revenue is not necessarily the one that leaves the most money with the investor.
Key considerations when comparing the two models:
- Does the property’s current licence and zoning permit nightly commercial accommodation, or only residential use?
- Does the underlying lease agreement (in a leasehold structure) permit STR activity, or does it restrict the property to personal use?
- Is the investor prepared to pay for, or actively participate in, professional STR management?
- Under the conservative occupancy scenario, does STR still outperform LTR on a net cash basis, or does LTR become the more rational choice?
- Does the guest market in the specific location support the nightly rate required for STR to justify its higher operating costs?
The comparison should always be made on equivalent net cash flow after all costs for each model — not by comparing gross STR revenue to net LTR income. A useful comparison requires applying the same discipline to both sides.
Compare Villas for Different Rental Strategies



 Bali, Canggu
 from 100м²
 Bali, Canggufrom 80м²
 Bali, Bukitfrom 480м²
How Leasehold Changes Investment Returns
Most villa investments available to foreign individuals in Bali involve leasehold arrangements — a contractual right to use and earn income from a property for a defined period, rather than the underlying land title. The financial implications of this structure are more significant than the simple annual yield figure suggests, and they are consistently underexplained in villa marketing material.
Foreign individuals cannot acquire Indonesian Hak Milik (freehold) land title. Depending on eligibility and transaction structure, property interests may involve contractual lease rights or qualifying land rights, while an Indonesian PT PMA may hold eligible rights such as HGB (Hak Guna Bangunan) subject to applicable requirements. The legal title, lease arrangement, operating entity, and business licence must each be checked separately. For a full explanation of the ownership structures available to foreign buyers, see “Leasehold vs Freehold in Bali“.
The remaining lease term defines the investment horizon. A villa with 25 years remaining on its lease has a materially different investment profile from one with 12 years remaining, even if both produce the same cash yield in year one. The 12-year lease has a shorter income runway and a narrowing window within which a resale at a reasonable price is realistic — any future buyer will apply the same lease-term analysis.
The arithmetic of payback period is a useful warning indicator for leasehold investments. Using the base-case scenario from Table 3 ($18,594 annual pre-tax cash surplus on $250,000 total invested capital), simple payback is approximately 13.4 years. This calculation ignores income tax, financing costs, inflation, downtime, reinvestment and the time value of money. A 25-year remaining lease would leave roughly 11.6 years after that hypothetical payback, but no resale value or renewal outcome can be inferred from this figure alone. Comparing simple payback with the remaining lease term is a useful warning indicator, but a full investment decision should use discounted cash flows, possible exit proceeds, and downside scenarios.
Under the conservative scenario ($8,220 per year), simple payback exceeds 30 years. This is longer than the 25-year lease assumed in the example, meaning the initial investment would not be recovered through operating cash surplus alone within that lease term under unchanged assumptions.
Lease renewal is a separate negotiation with the landowner, not an automatic right, and carries its own cost. The price of extension, the landowner’s willingness to renew, and the terms of an extended agreement are not guaranteed at the point of original purchase. A villa with a 25-year lease and an undocumented informal renewal expectation is not equivalent to one with a 25-year lease and a written renewal clause at a pre-agreed price.
Distinguishing the core metrics:
- Pre-tax cash yield — annual operating cash surplus as a percentage of total invested capital; reflects the current year’s performance only
- Payback period — years required to recover total invested capital through income alone at a constant annual surplus; useful as a stress test, not a guaranteed outcome
- Total return — accumulated income plus net resale proceeds at exit; depends entirely on achievable resale price and remaining lease term
- IRR (internal rate of return) — measures the discount rate at which the net present value of projected cash flows equals zero; useful for comparing investment scenarios with different cash-flow timing, but should be considered alongside NPV, total cash proceeds, capital requirements and lease-term risks rather than in isolation
Rental cash flow and long-term investment return are not the same thing.
Why a 7.44% annual cash yield is not a 7.44% lifetime investment return
Consider the illustrative villa with $250,000 in total invested capital, $18,594 annual pre-tax cash surplus and a 25-year remaining lease.
If that cash surplus stayed unchanged for all 25 years, the cumulative undiscounted cash surplus would be $464,850 before income taxes, financing, extraordinary expenditure and any additional lease payments.
This does not mean the investor earns $464,850 in profit. The initial $250,000 investment must also be recovered, and future cash flows are worth less than cash received today. Any resale proceeds, lease extension payments and terminal value must be modelled separately.
A complete investment appraisal should therefore include annual cash flows, discount rate, remaining lease duration, capital expenditure, possible exit proceeds and downside scenarios.
Note on leasehold amortisation: the economic value of the remaining lease reduces with each passing year, which affects resale pricing. This is a factor in total return analysis, not an annual cash payment that appears in the operating cash flow. Do not treat it as a cost that reduces annual rental income — but do account for it when assessing the investment’s long-term economics.
Taxes, Licensing and Legal Risks
The ability to earn rental income legally and retain it efficiently depends on several property-specific factors. Errors in this area are not merely inconvenient — they can result in fines, operational suspension, or complications with lease enforcement that no rental yield can compensate for.
Ownership structure. Foreign nationals cannot hold freehold Hak Milik land title in Indonesia. Property interests for foreign investors typically involve contractual lease rights or qualifying land rights. A PT PMA — a foreign-owned Indonesian limited liability company — may hold eligible land rights such as HGB, subject to applicable requirements, and carries its own registration requirements, corporate compliance costs, and tax obligations. The legal title, lease arrangement, operating entity, and business licence must each be assessed separately. See “PT PMA for Bali Property” for a detailed breakdown.
Zoning and permitted use. Verify the applicable spatial plan — the relevant RDTR (Detailed Spatial Plan) or RTRW (Regional Spatial Plan) — any required spatial-use approval (KKPR/PKKPR), the building’s registered function, and the relevant accommodation-business permissions for the exact location and intended operation. A villa generating strong rental income on land zoned for residential use only, or operating a commercial accommodation business without the correct permissions, is exposed to regulatory risk regardless of financial performance.
Building and operational permits. Check the building’s existing IMB/PBG history, its approved function, and the applicable SLF (certificate of fitness for function) requirements. For existing buildings without complete permit documentation, the available compliance procedures must be verified with the competent local authority under the regulations currently in force. Operational licences for hosting paying guests are processed through Indonesia’s OSS (online single submission) system; the correct business classification should be confirmed against KBLI 2025 (code 55203 for villa accommodation, replacing the earlier KBLI 2020 code 55193), with the actual operator and service model determining the appropriate licensing route. A full walkthrough of the licence requirements is set out in “Bali Villa Rental Licence“.
Taxation. The applicable tax treatment differs between an accommodation-services business and a conventional land or building lease. Indonesia’s PBJT (pajak barang dan jasa tertentu) may apply to qualifying hotel-style accommodation under the relevant regional regulation. PP 34/2017 provides a 10% final income tax on gross land and building rent income but expressly excludes accommodation-service income from that category — meaning the income-tax treatment of a villa operated as a commercial accommodation business must be determined separately, and may follow a different mechanism. In a PT PMA structure, corporate income tax obligations apply in addition. The investor’s reporting obligations in their home country on foreign-source income are a further consideration. See “Property Taxes in Bali” for a structured overview. Applicable rates and mechanisms depend on the municipality, operator structure, contractual arrangements, and current regulations; an accountant familiar with both Indonesian tax law and the investor’s home jurisdiction should be consulted before purchase.
Licence transferability. Check which permissions attach to the building, the business operator, or the legal entity; whether any change of ownership or operator requires amendment, reissue, or a new application; and whether operations can legally continue during the transition period. Assuming that existing licences automatically transfer with a property sale is a risk that should be verified, not assumed.
In this section, only the framework relevant to yield analysis is covered. These are not legal or tax conclusions specific to any investor’s circumstances.
How to Verify a Villa’s Projected ROI

A projected ROI in a sales presentation is a model, not a result. For an off-plan villa, there is no operating history at all — only the developer’s assumptions about what a completed property might earn. For an existing villa, actual performance data should be available and independently verifiable. The following checklist applies to both situations.
Due diligence checklist for verifying villa rental yield projections:
- Request booking records — for an existing rental villa, ask for 24 months of booking data showing check-in dates, actual nightly rate charged, nights booked, and nights blocked; monthly breakdowns reveal seasonality clearly
- Request payout statements — bank or platform payout statements confirming cash actually received by the owner, net of platform fees; compare these against gross booking records to verify what deductions were applied and at what rates
- Compare with market-equivalent listings — using AirDNA or direct platform research, assess whether the villa’s claimed ADR is consistent with comparable properties in the same area during the same periods
- Review the management contract in full — confirm the fee percentage, the base it is calculated on, what services are included, termination rights, and what happens to forward bookings if the management relationship ends
- Verify OTA commission structure — obtain written confirmation of which platforms are used, the actual commission rate applicable to this specific listing, and whether the platform fee and management fee are charged on the same base or different bases
- Request utility bills — obtain 12 months of electricity and water statements; these expenses can be material for villas with pools and extensive air-conditioning, and actual bills provide a more reliable basis for projections than generic estimates
- Ask specifically about deferred maintenance — a vendor may defer repairs or equipment replacement prior to sale; these costs transfer to the buyer and should be identified before completion
- Verify all permits and licences — confirm that building documentation, operational licences, spatial-use approvals, and OSS classifications are current, held by the correct entity, and that the position on transferability upon change of ownership or operator has been established
- Assess the leasehold position thoroughly — confirm the remaining term, whether a renewal right is documented and at what cost, and whether the lease can be legally assigned to a new investor
- Rebuild the conservative scenario independently — using only data you have verified, run the conservative case from Table 3; a conservative scenario is a stress test, not a guaranteed minimum return; repeat it with lower occupancy, unexpected repairs, tax and regulatory changes, and delayed operations
For off-plan properties, no booking history exists and the projection is entirely model-dependent. The developer’s assumptions about ADR, occupancy, management costs, and delivery timeline are unverified at the point of sale.
What does an advertised 15% rental yield actually mean?
For a villa requiring $250,000 in total invested capital, a 15% annual yield represents $37,500. But that figure has very different meanings depending on whether it is calculated before or after expenses.
| Advertised claim | Annual amount | What it means |
|---|---|---|
| 15% gross yield | $37,500 revenue | Before operating costs, tax and financing |
| 15% pre-tax cash yield | $37,500 cash surplus | After modelled operating costs and capex reserve, before tax and financing |
| 15% after-tax cash yield | $37,500 | Cash surplus after applicable income taxes, financing payments and other modelled cash obligations, divided by total invested capital |
Under the illustrative cost assumptions used earlier in this guide, generating $37,500 in pre-tax cash surplus would require approximately $66,429 in annual gross booking revenue.
At $180 ADR, that would mean approximately 369 booked nights — more than a calendar year allows. At a higher ADR, the occupancy requirement would be lower, but it would still need to be verified against comparable rental properties.
Guaranteed yield offers warrant particular scrutiny. When a developer or management company guarantees a yield, ask: who is providing the guarantee and what is their financial standing; what conditions can reduce or void the payment; for how long does the guarantee apply; and whether the guaranteed amount is funded from actual rental revenue, from a reserve built into the purchase price, or from the developer’s own operating capital. A guarantee from a thinly capitalised entity, or one implicitly funded by inflating the acquisition price, is not evidence of investment quality. See “Bali Property Due Diligence Checklist” for a complete documentation framework.
Need Help Checking a Villa’s Rental Projection?
Share your preferred location and budget. We can help you identify suitable properties and clarify which rental assumptions and documents should be checked before purchase.
Get a Personalised Villa Shortlist
Is a Bali Rental Villa a Good Investment?
The answer depends on what the investor is trying to achieve and how they approach the market.
For buyers who enter with realistic assumptions, invest in a well-located property with appropriate professional management, and commit at a total capital cost that leaves room for operating costs and a period of below-forecast occupancy, Bali’s rental market offers genuine income potential. The tourism infrastructure is established, international arrival numbers remain substantial, and the demand profile is diverse enough to support different villa categories and price points across the island’s main corridors.
For buyers who expect passive income from a self-managing property, who accept developer yield projections without independent verification, or who base their return expectations on the optimistic scenario rather than stress-testing the conservative one, the same market carries meaningful downside risk.
Total invested capital matters more than the projected yield headline. A claimed yield needs to be tested against independently verifiable booking revenue, costs, and lease economics. A pre-tax cash yield figure alone does not establish investment suitability: lease duration, legal enforceability of the ownership structure, capital expenditure requirements, tax position, liquidity, and risk-adjusted lifetime cash flows all form part of the decision. Properties with different lease terms, regulatory positions, and cost structures cannot be compared on gross yield alone.
Looking for a Bali villa with realistic rental potential? ULU-Homes can help you shortlist properties based on your budget, preferred location and investment goals. Find your Bali property.
Final Thoughts
Three disciplines separate a sound villa investment decision from one based on a developer’s best-case model. First, calculate yield after costs — not before them, not from a gross revenue headline, but from a line-item cost structure you have verified or conservatively estimated, with total invested capital as the denominator. Second, confirm the numbers behind any projection with documentation from the specific property — actual booking records, utility bills, payout statements, management contracts, and permit documentation — rather than accepting a presentation at face value. Third, evaluate the investment as a whole picture: annual rental income relative to total invested capital, the remaining lease term and its renewal position, the legal compliance of the property’s ownership and operating structure, and the outcome under a conservative scenario stress-tested below the base case.
The Bali market supports genuine rental income for investors who approach it with clear analysis. The gap between an advertised gross yield and a realised pre-tax cash yield is not an anomaly — it is the predictable result of costs that are always present but rarely included in the headline figure. The most reliable approach to comparing any two properties is to apply the same financial model to both, use the same total invested capital as the denominator, include the same cost categories, and test both against a conservative scenario that reflects realistic demand, not peak performance.
 Real estate in Georgia
 Real estate in Cyprus
 Real estate in the UAE
 Real estate in Montenegro
 Real estate in Thailand
 Real estate in Spain
 Real estate in Saudi Arabia
 Real estate in Turkey
 Real estate in Zanzibar
 +62 895 001 924 667
 hello@ulu-homes.id
 Tibubeneng, Canggu, Kuta Utara, Badung Regency, Bali 80361, Indonesia




 Get catalogue of TOP-7 objects